
Statistics are essential for offering unbiased insights when evaluating the safety and security of cities. We will examine the most hazardous cities in New Jersey in this blog post, evaluating the information and highlighting the issues that need to be addressed. Through an analysis of crime rates, population densities, and other pertinent data, our goal is to present a thorough picture of the New Jersey cities that have major safety concerns.
With this knowledge, citizens and decision-makers may better comprehend these cities and endeavour to put into place practical solutions to enhance public safety. Now let’s examine the data and learn the real story behind Garden State’s most hazardous communities.
The Latest Most Dangerous Cities In New Jersey:
Camden:
- The rate of violent crime in New Jersey is 1,603/100,000 (average: 195/100,000).
- NJ Average: 1,158/100k people; Property Crime Rate: 2,159/100k people
- 3,762/100,000 reported crimes overall (average for New Jersey: 1,354/100,000)
Camden often ranks among the riskiest cities in New Jersey. Situated on the other side of the Delaware River from Philadelphia, it has several social difficulties, including unemployment and poverty. A high crime rate, particularly for serious crimes, makes Camden unsettling for both locals and tourists.
Atlantic City:
- NJ’s average violent crime rate is 195 per 100,000 inhabitants, compared to 823/100k.
- NJ Average: 1,158/100k people; Property Crime Rate: 2,698/100k people
- 3,521/100,000 reported crimes overall (average for New Jersey: 1,354/100,000)
Despite being well-known for its casinos and tourism destinations, Atlantic City struggles with unemployment, poverty, and gambling addiction. The city is among the most hazardous in New Jersey because of these problems, which also raise the crime rate in the area.
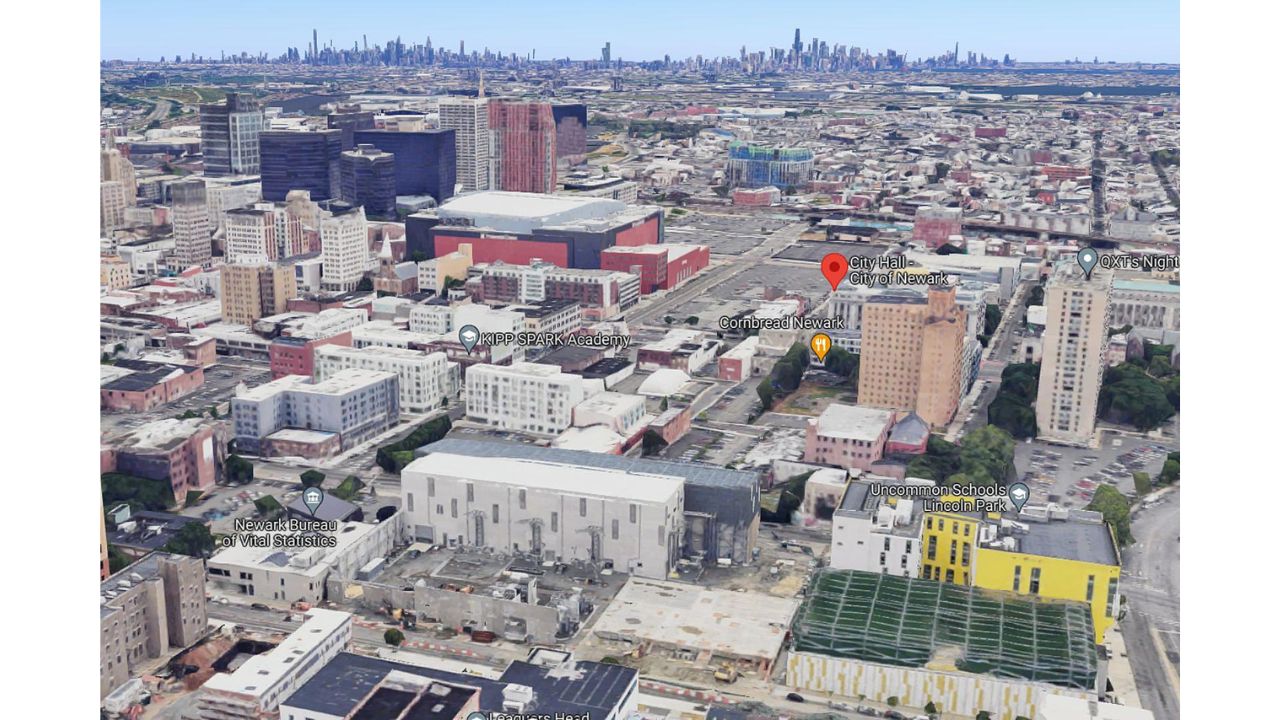
Newark:
- Rate of violent crime: 490 per 100,000 persons (average for New Jersey: 195 per 100,000)
- NJ Average: 1,158/100k people; Property Crime Rate: 1,457/100k persons
- (1,947 crimes reported per 100,000 people; NJ average: 1,354 crimes per 100,000 persons)
The largest city in New Jersey, Newark, is a busy hub for transportation and business. But it faces formidable obstacles in the form of serious crime problems, especially in some communities. The city’s persistently high crime rates are greatly influenced by elements like poverty and drug-related issues.
The East Orange:
The number of violent crimes committed in East Orange per 1,000 inhabitants is shown by the figure “The East Orange, New Jersey violent crime rate is 8.93 per 1,000 residents.” Crimes classified as violent include murder, robbery, assault, and sexual assault. With a rate of 8.93, it means that for every 1,000 residents in East Orange, there were around 8.93 violent crime events. By enabling comparisons with other areas and the tracking of trends in criminal activity, this statistic aids in the understanding of the relative degree of violent crime in the city.
Trenton:
- Rate of violent crime: 1,169 per 100,000 inhabitants (average for New Jersey: 195 per 100,000)
- NJ Average: 1,158/100k people; Property Crime Rate: 2,090/100k people
- NJ average: 1,354 per 100,000 people; total crimes reported: 3,259 per 100,000 people
For a long time, Trenton, the state capital of New Jersey, has struggled with crime. The high crime rates in the city, particularly about violent and property crimes, contribute to its ranking as one of the worst in New Jersey.
Paterson:
- Rate of violent crime: 989 per 100,000 inhabitants (average for New Jersey: 195 per 100,000)
- NJ Average: 1,158/100k people; Property Crime Rate: 1,490/100k persons
- NJ average: 1,354 per 100,000 people; total crimes reported: 2,479 per 100,000 people
The third-largest city in New Jersey, Paterson, is renowned for its extensive industrial past. But it has several difficulties, one of which is the high prevalence of crime. In some parts of the city, violent crimes and property crimes are very common. These crime issues are a result of several factors, including relative population density, unemployment, and poverty.
Irvington:
The number of violent crimes committed in Irvington, New Jersey, per 1,000 population is shown by the figure “Irvington, New Jersey has a violent crime rate of 11.06 per 1,000 residents.” Acts like committing murder, theft, and aggravated assault are examples of violent crimes. With a rate of 11.06, it indicates that there are about 11 violent crime events per 1,000 inhabitants in Irvington. This figure may be used as a benchmark for evaluating community safety and allows one to compare the incidence of violent crimes in various locations.
Orange:
According to the data, Orange, New Jersey has a violent crime rate of 6.61 per 1,000 residents, which indicates that there are around 6.61 violent crime events recorded for every 1,000 residents in Orange, New Jersey. The frequency of violent crimes in the city’s population is shown by this statistic, which gives an indication of the degree of violent crime in the area. It aids in evaluating the area’s safety and security, as higher rates correspond to a higher risk of violent crime in comparison to lower rates.
Elizabeth:
- NJ average: 195/100,000; violent crime rate: 480/100,000
- NJ Average: 1,158/100k people; Property Crime Rate: 2,219/100k people
- 1,354 crimes per 100,000 persons in New Jersey, compared to 2,699 crimes overall reported.
Elizabeth, a thriving city in Union County, has some crime problems, mostly because of its proximity to Newark. The city has higher crime rates than the state average, especially when it comes to violent and property crimes.
Asbury Park:
- NJ average: 195/100,000; violent crime rate: 1,226/100,000
- NJ average: 1,158/100,000; property crime rate: 3,424/100,000
- 4,651/100,000 reported crimes overall (average for New Jersey: 1,354/100,000)
The Monmouth County seaside community of Asbury Park has undergone several redevelopment initiatives recently. Even with these improvements, the city continues to have difficulties with drug-related crimes and property violations, making it one of the riskier communities in New Jersey.
Jersey City:
According to the data, for every 1,000 people in the city of Jersey City, New Jersey, there are 3.91 violent crime events reported. About the city’s population, this rate gives an estimate of how frequently violent crimes like robbery, assault, and homicide occur there. In the city, a larger rate implies a higher frequency of violent crime, whilst a lower rate denotes a lesser occurrence. This figure offers insightful data on Jersey City citizens’ safety and security and may be used as a starting point to assess how crime rates have changed over time or to compare Jersey City’s crime rate to those of other cities.
Plainfield:
The frequency of violent crimes in Plainfield, New Jersey in proportion to its population is shown by the statistic “In Plainfield, New Jersey, the violent crime rate is 5.62 per 1,000 residents.” There are around 5.62 violent crime cases per 1,000 inhabitants in the region. With the use of this data, one can compare Plainfield’s safety and security level to that of other places and determine the relative risk of violent crime.
Passaic:
According to the data, there are 4.91 violent crimes per 1,000 people in Passaic, New Jersey. This indicates that 4.91 persons in every 1,000 residents of Passaic are victims of violent crimes. Crimes like murder, assault, robbery, and sexual assault that entail the use or threat of force are referred to as violent crimes. Residents and politicians may evaluate the frequency of violent crimes in the region and make well-informed decisions to address and avoid such instances by using this statistic, which gives an indicator of the degree of safety and security in the area.
Union City:
The exact number of violent crimes per 1,000 persons in Union City, New Jersey, is shown by the figure “Violent crime rate is 4.30 per 1,000 residents.” Crimes like murder, assault, robbery are considered violent crimes. For every 1,000 inhabitants in this particular area, there are about 4.30 violent crimes reported. This statistic provides an overview of Union City’s security and safety conditions; a lower percentage denotes a less violently crime-ridden community.
Vineland:
The amount of violent crimes per 1,000 people in Vineland, New Jersey, is known as the violent crime rate. In Vineland, there are 4.13 violent crime events (such as homicide, robbery, or assault) for every 1,000 residents, according to the data. A greater rate indicates a higher chance of violent crimes occurring in the city. This data gives an indicator of the safety and security level in the city.
Read Also – $3400 Direct Deposit for May 2024: Get More Updates